Introduction #
The Board-level Dashboard in Kaamfu gives a high-level view of work progress, assignments, and team effort across an entire Board. It helps users analyze performance trends, understand workload distribution, and make informed decisions based on real-time Board data.
Why This Feature Matters #
The Board-level Dashboard simplifies complex data into an accessible visual format. It provides actionable insights that help improve efficiency and alignment across teams.
Here’s why this feature is important:
- It allows leaders to track total effort and progress without switching between multiple views.
- It highlights both assigners and assignees, giving a clear picture of who’s creating and completing work.
- It visualizes workflow stages through the Cumulative Flow Diagram for better process monitoring.
With these insights, teams can quickly identify bottlenecks and optimize workload distribution.
Who Should Read This #
This feature is most useful for:
- Admins and Board Owners monitoring overall performance.
- Team Leads analyzing assignments and effort allocation.
- Members who want to view progress and workload distribution at a glance.
All users can benefit from understanding the data presented in this dashboard.
What This Guide Covers #
This guide explains what the Board-level Dashboard is, what data it shows, and how it helps you understand team progress and productivity at a glance.
Feature Overview #
The Board-level Dashboard provides analytical insights into a Board’s activities, including total effort, progress visualization, and participant roles. You can access it from the main header by selecting the Dashboard icon to toggle it open or closed.
The dashboard is divided into distinct sections, each displaying key metrics and visuals related to your Board’s activity.
.
.
Key Sections #
Each section of the Board-level Dashboard offers a unique view of Board data.
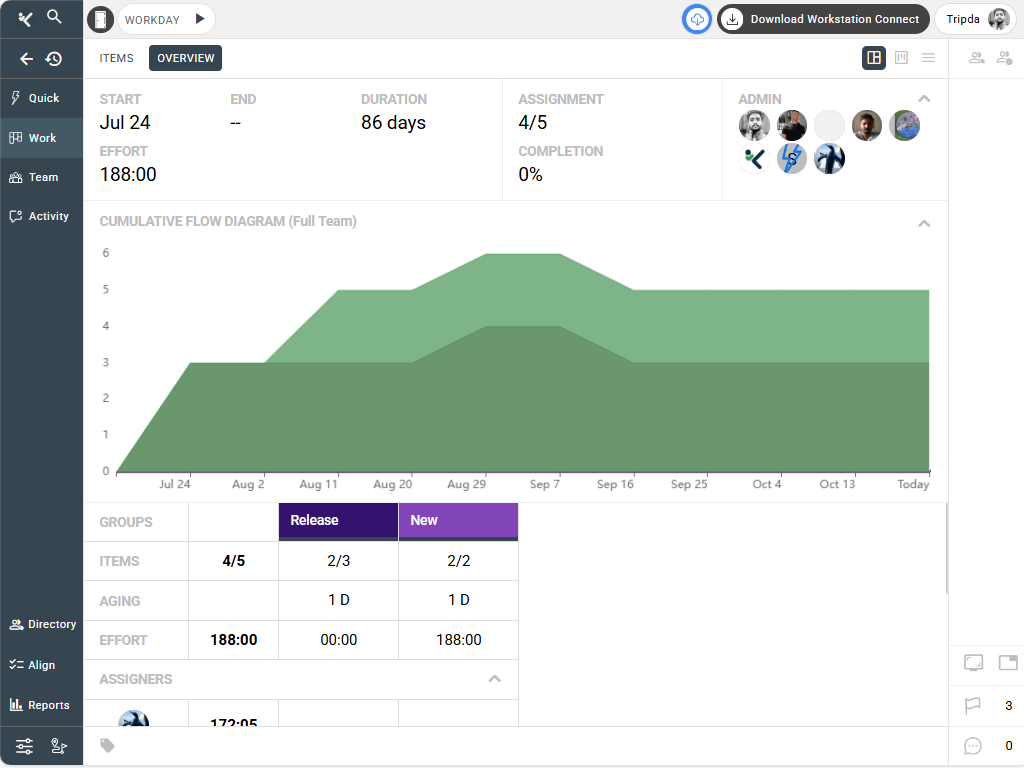
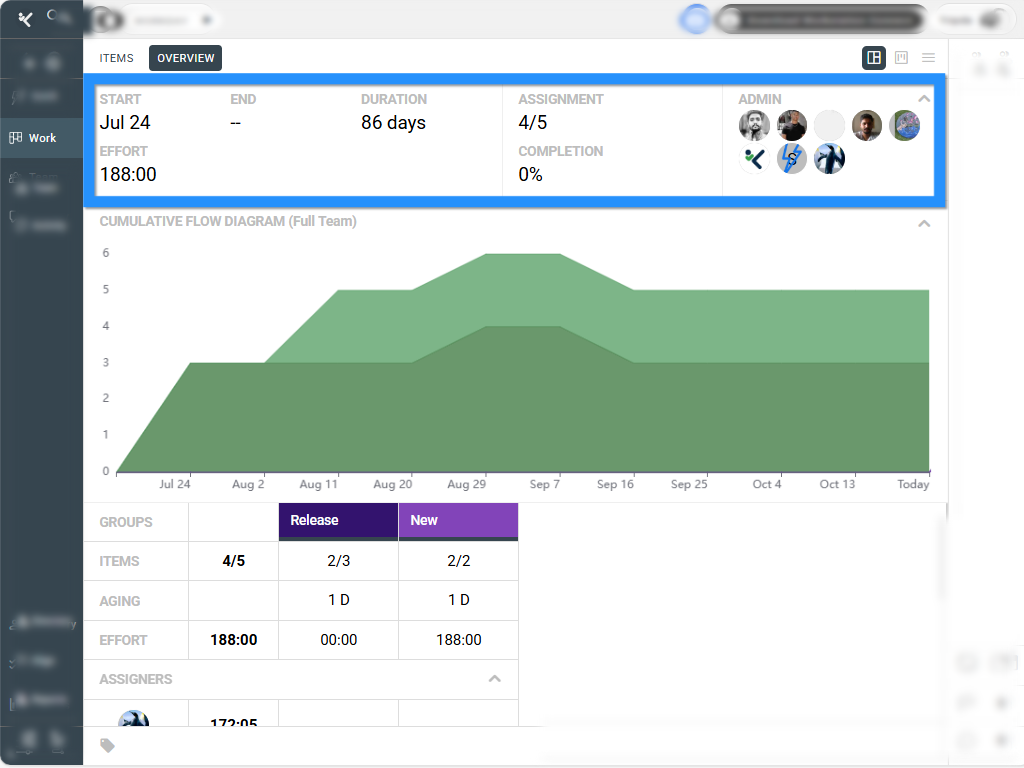
- Top Row – Board Overview
This section displays the overall Board data, including start date, end date, duration, total effort, number of assignments, and list of admins.
.
.
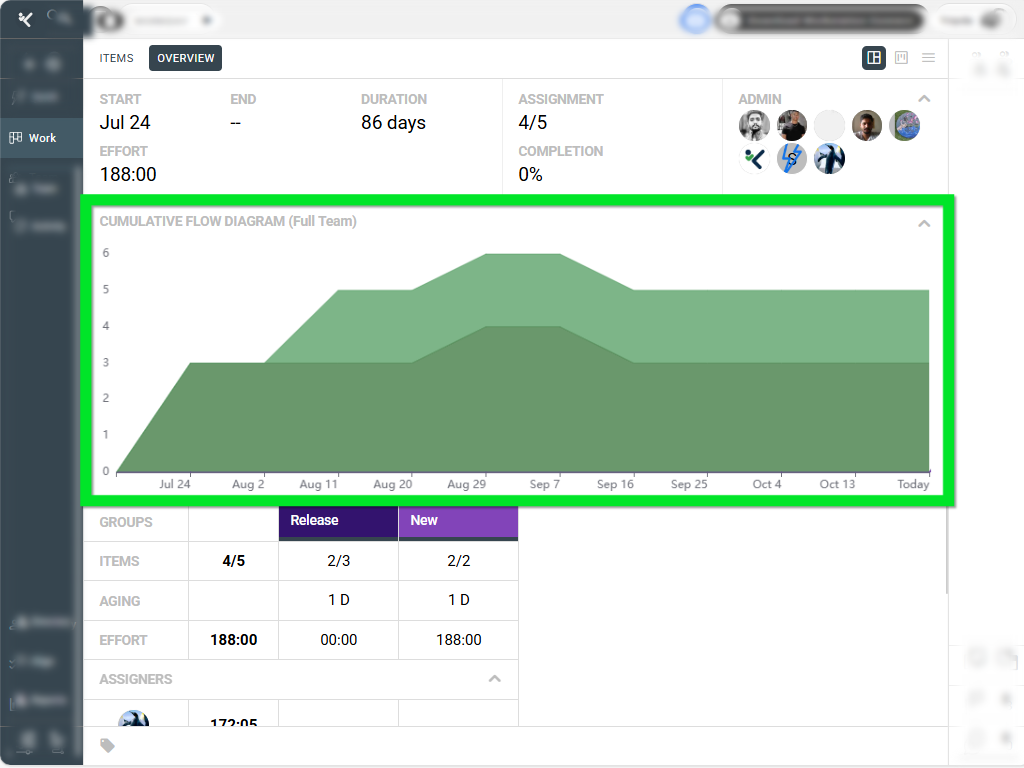
- Cumulative Flow Diagram (CFD)
This diagram provides a visual representation of how tasks progress through different Item Groups in the Board. It helps identify task distribution and flow consistency over time.
.
.
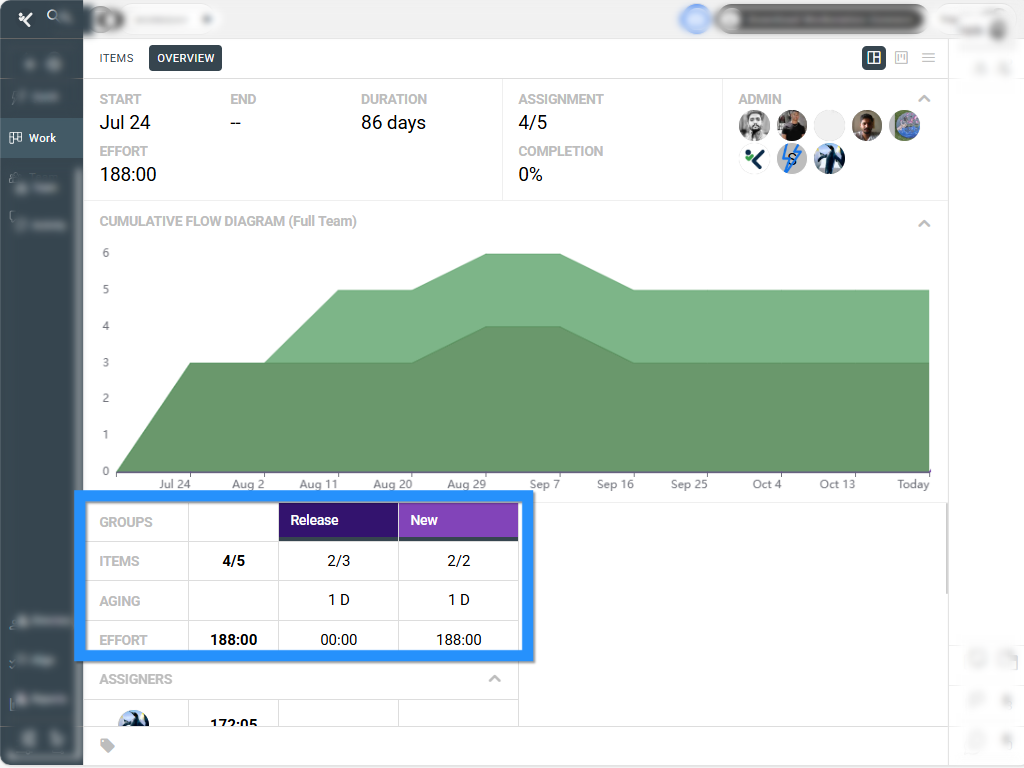
- Groups – Item Group Data
This table shows key metrics for each Item Group, including number of items, task aging, and effort. It gives a quick snapshot of workload and progress per group.
.
.
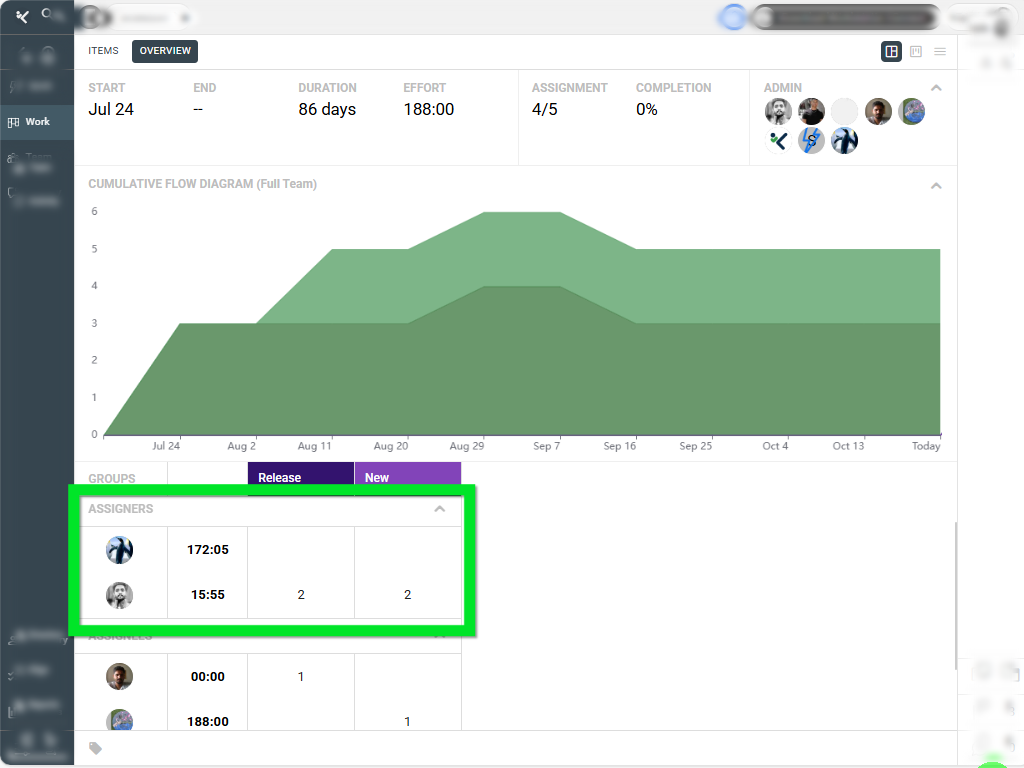
- Assigners
Displays all assigners within the Board, showing how many tasks each assigner has created per Item Group. This helps understand delegation patterns.
.
.
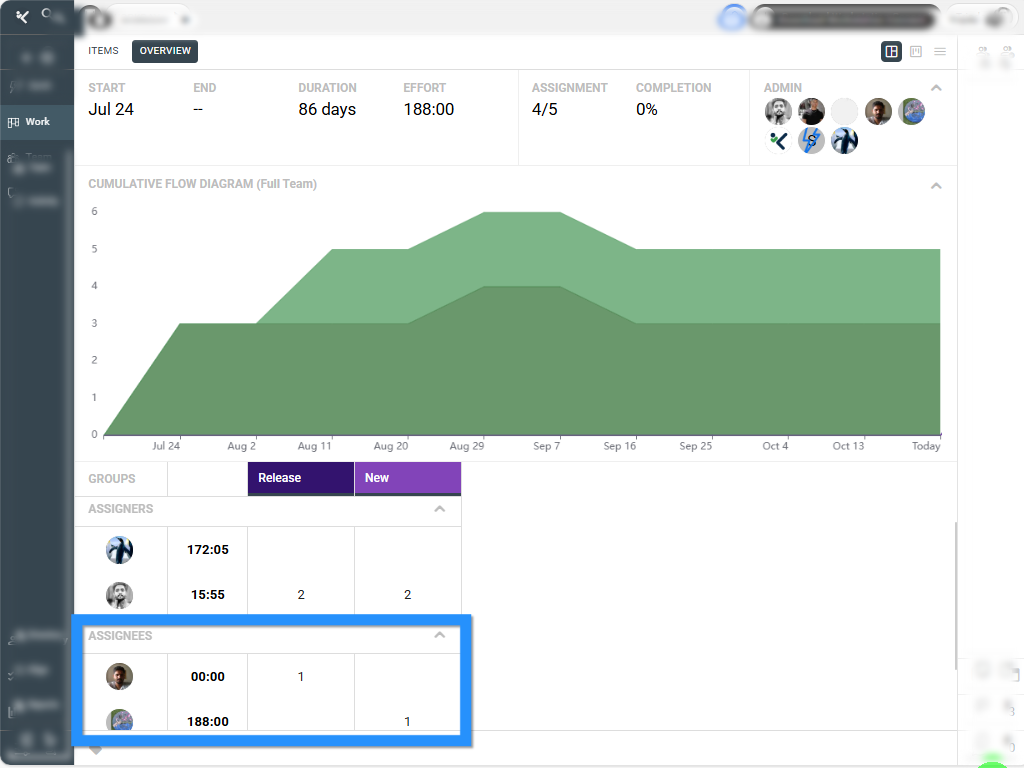
- Assignees
Displays all assignees and the number of tasks assigned to them per Item Group. This allows tracking workload distribution across the team.
.
.
Each of these sections collectively gives a complete view of Board performance and team effort.
Key Benefits #
The Board-level Dashboard helps teams make data-driven decisions and stay aligned. Some of its key benefits include:
- Centralized visibility of all Board activities.
- Real-time understanding of workload distribution.
- Better tracking of task flow and team performance.
- Easy access via the Dashboard icon in the header.
By using this dashboard regularly, teams can ensure balanced task allocation and maintain consistent productivity.
Related Resources #
If you want to explore related tools and concepts, check out these guides:
- Understanding Item Groups in a Board
- Using the Cumulative Flow Diagram for Progress Tracking
- How to Analyze Effort Metrics in Kaamfu
These resources help you interpret and use dashboard data more effectively.